Basic stuff from orgmode itself:
2019-05-20, updated 2019-05-20 next - previous
Just some examples on how you can use orgmode on your blog.
table:
| dsdds | dsdsd |
| ss | ss |
\(LATEX\)
At the moment if you generate an image using code, it must be in an \/extension\/ folder. Other images can be anywhere and they will be properly moved.
Some tikz:
\begin{tikzpicture}
\draw[->] (-3,0) -- (-2,0) arc[radius=0.5cm,start angle=-180,end angle=0] (-1,0) -- (1,0) arc[radius=0.5cm,start angle=180,end angle=0] (2,0) -- (3,0);
\filldraw (-1.5,0) circle[radius=1mm];
\filldraw (1.5,0) circle[radius=1mm];
\end{tikzpicture}
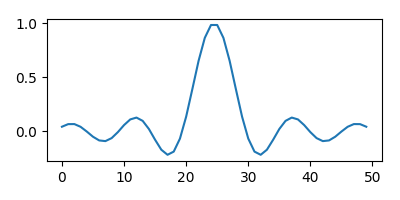
some code:
import matplotlib, numpy
matplotlib.use('Agg')
import matplotlib.pyplot as plt
fig=plt.figure(figsize=(4,2))
x=numpy.linspace(-15,15)
plt.plot(numpy.sin(x)/x)
fig.tight_layout()
plt.savefig('./png/python-matplot-fig.png')
return './png/python-matplot-fig.png' # return filename to org-mode
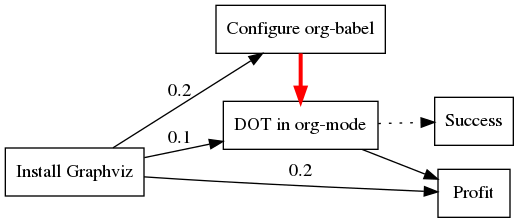
  digraph {
  // graph from left to right
  rankdir=LR;
  splines=true;
  node [shape=box];

  id [label="Install Graphviz"]
  conf [label="Configure org-babel"]
  dot [label="DOT in org-mode"]

  id -> conf [label="0.2", weight=1]
  conf -> dot[color=red, penwidth=3.0]
  id -> dot [label="0.1", weight=2]
  dot -> "Profit"
  id -> "Profit"  [label="0.2", weight=3]
  dot -> "Success" [style=dotted]
  {rank=same; conf,dot}
}